




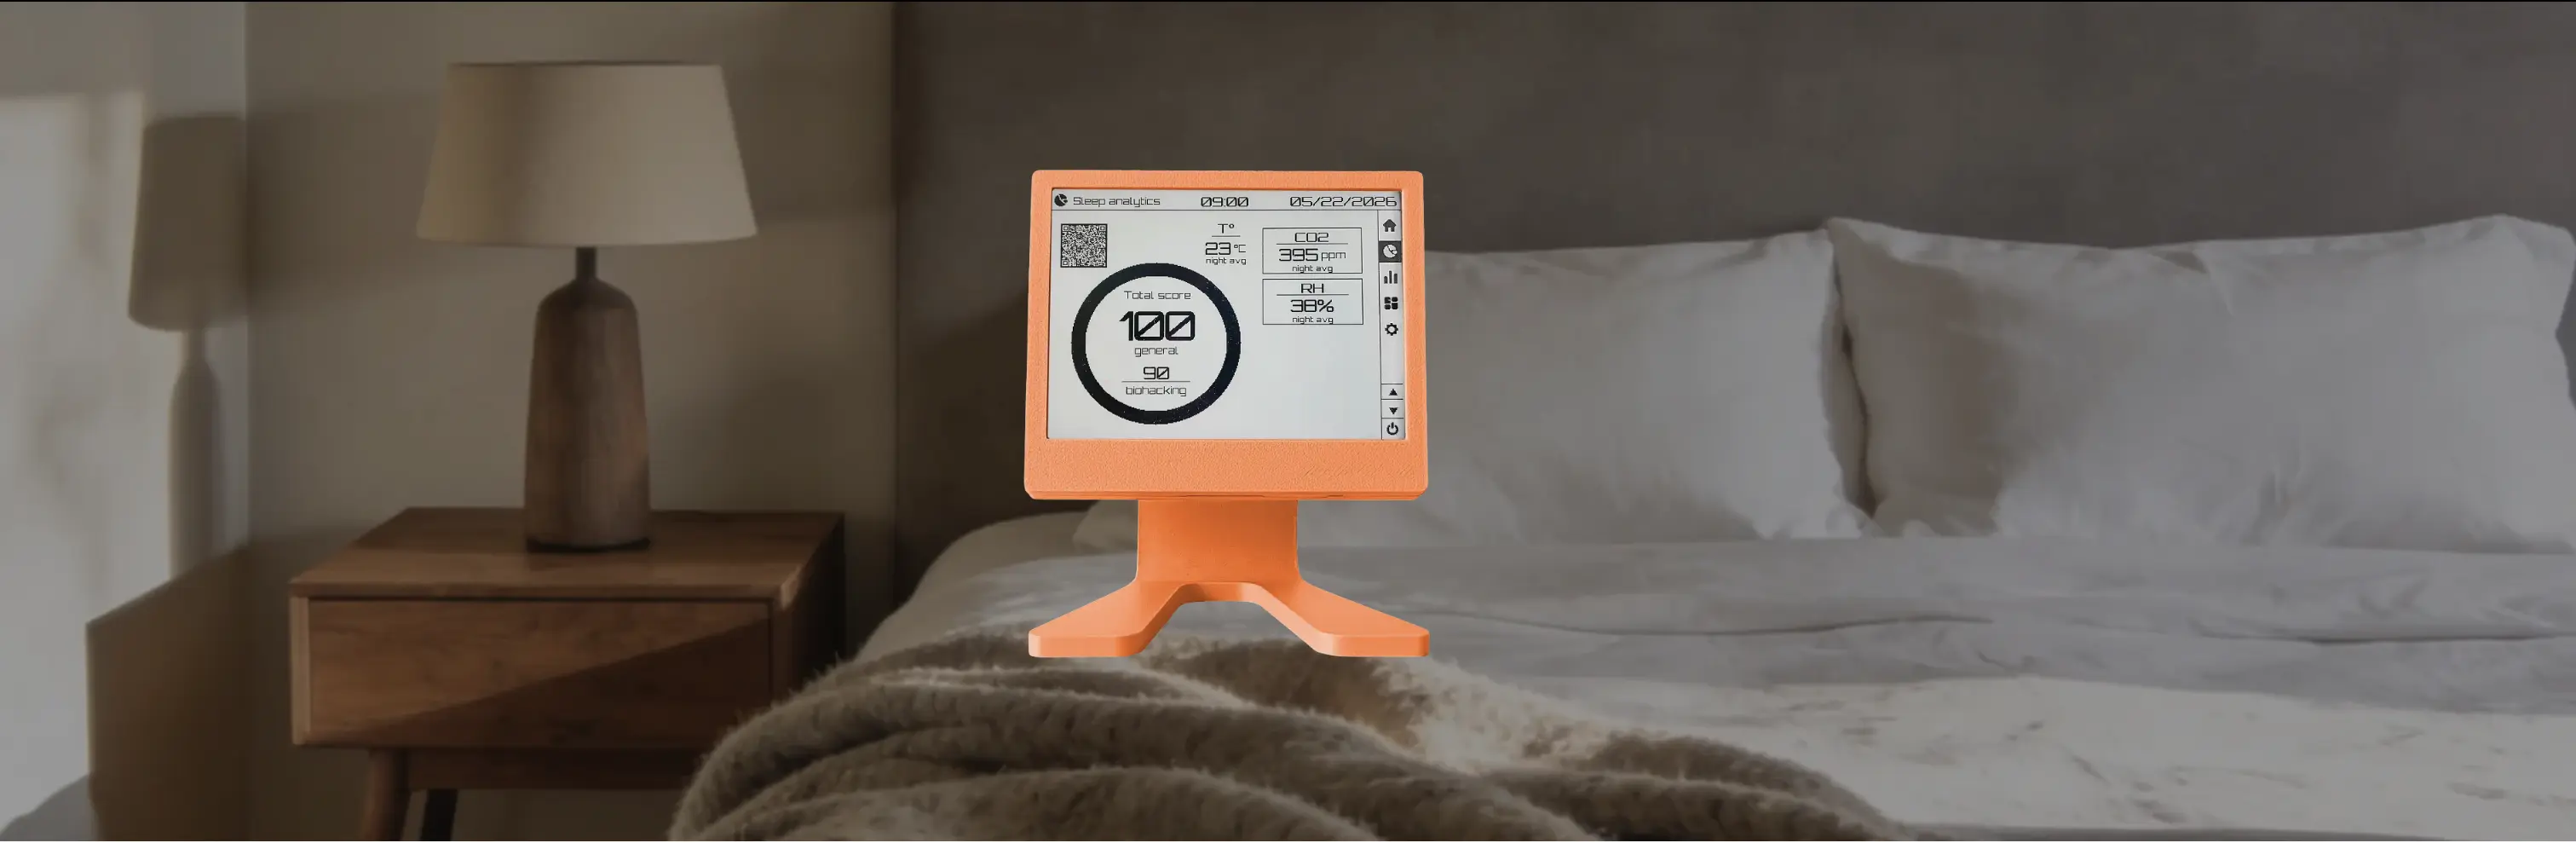
Insight Sleep Analytics: Understanding Your Night Report and Comfort Score
Insight Sleep Analytics transforms bedroom environmental data (CO₂, temperature, humidity, PM2.5, and noise) into a nightly comfort report and score based on research-informed thresholds.
Your bedroom environment changes throughout the night — often in ways you don’t notice. Insight Sleep Analytics turns those subtle changes into a simple morning summary of how comfortable your sleep environment was.
The system evaluates:
- CO₂ concentration
- Temperature
- Humidity
- PM2.5 (when available)
- Noise peaks (when available)
It then produces a Night Report and a Comfort Score that reflects overall environmental conditions during sleep.
The Sleep Score reflects environmental comfort, not sleep stages or medical sleep quality.
Target Ranges at a Glance
| Metric | General | Biohacking |
|---|---|---|
| CO₂ | ≤ 750 ppm | ≤ 600 ppm |
| Temperature | 19–22°C | 17–20°C |
| Humidity | 40–60% | 40–50% |
| PM2.5 | ≤ 5 µg/m³ | ≤ 3 µg/m³ |
| Noise | ≤ 5 hours with peak > 45 dB | ≤ 1 hour with peak > 45 dB |
Your Night Report at a Glance
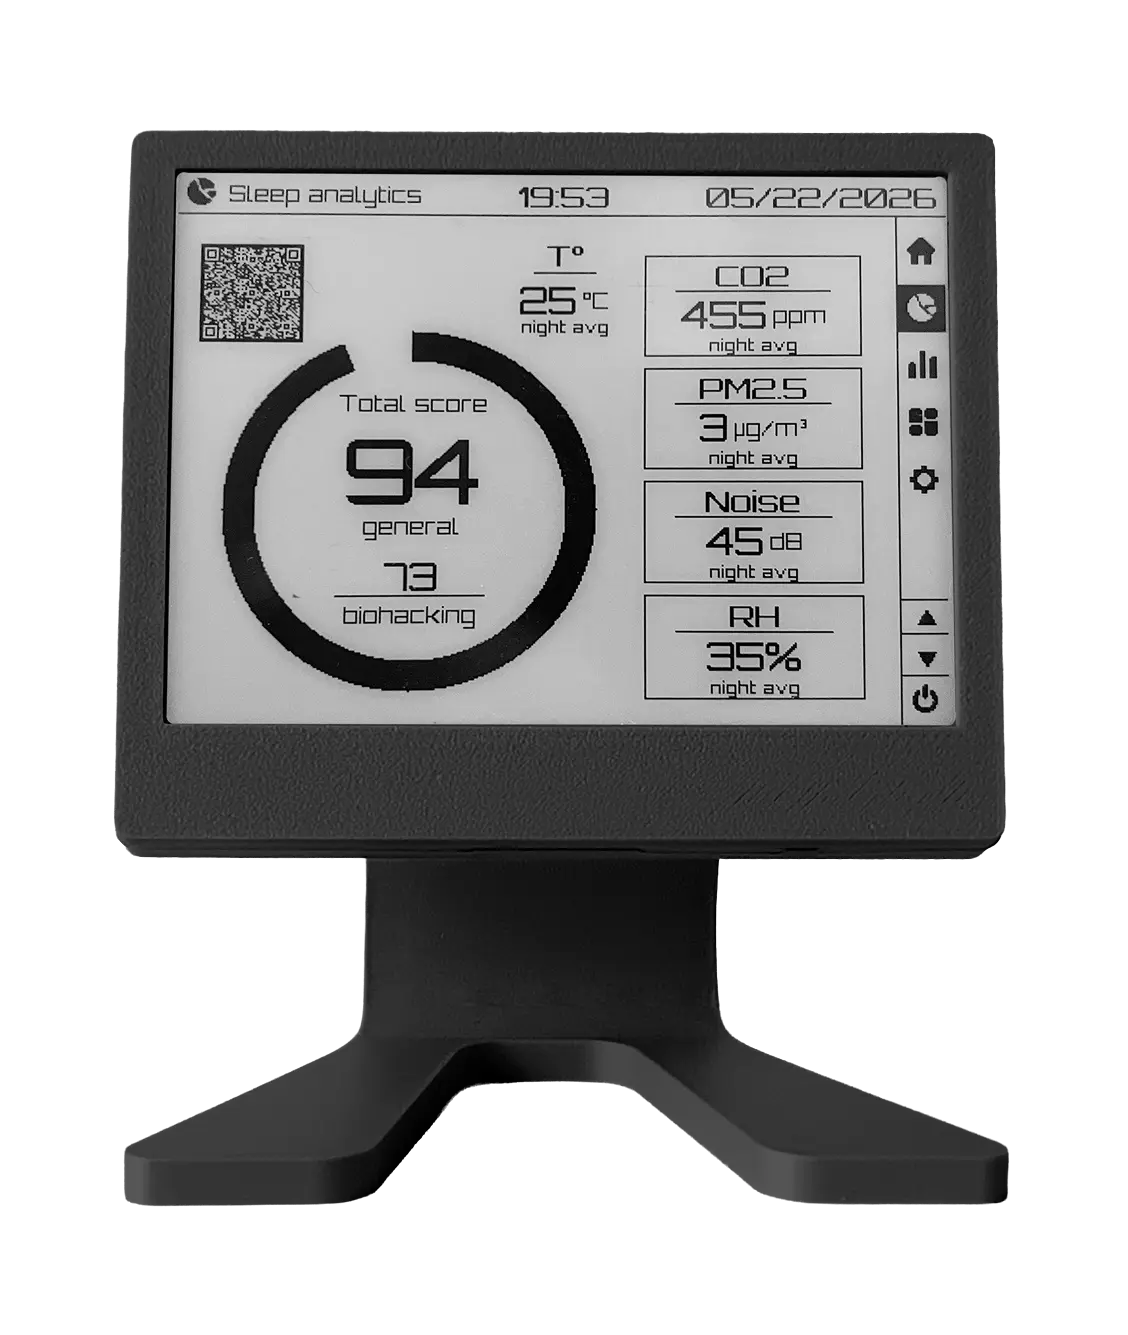
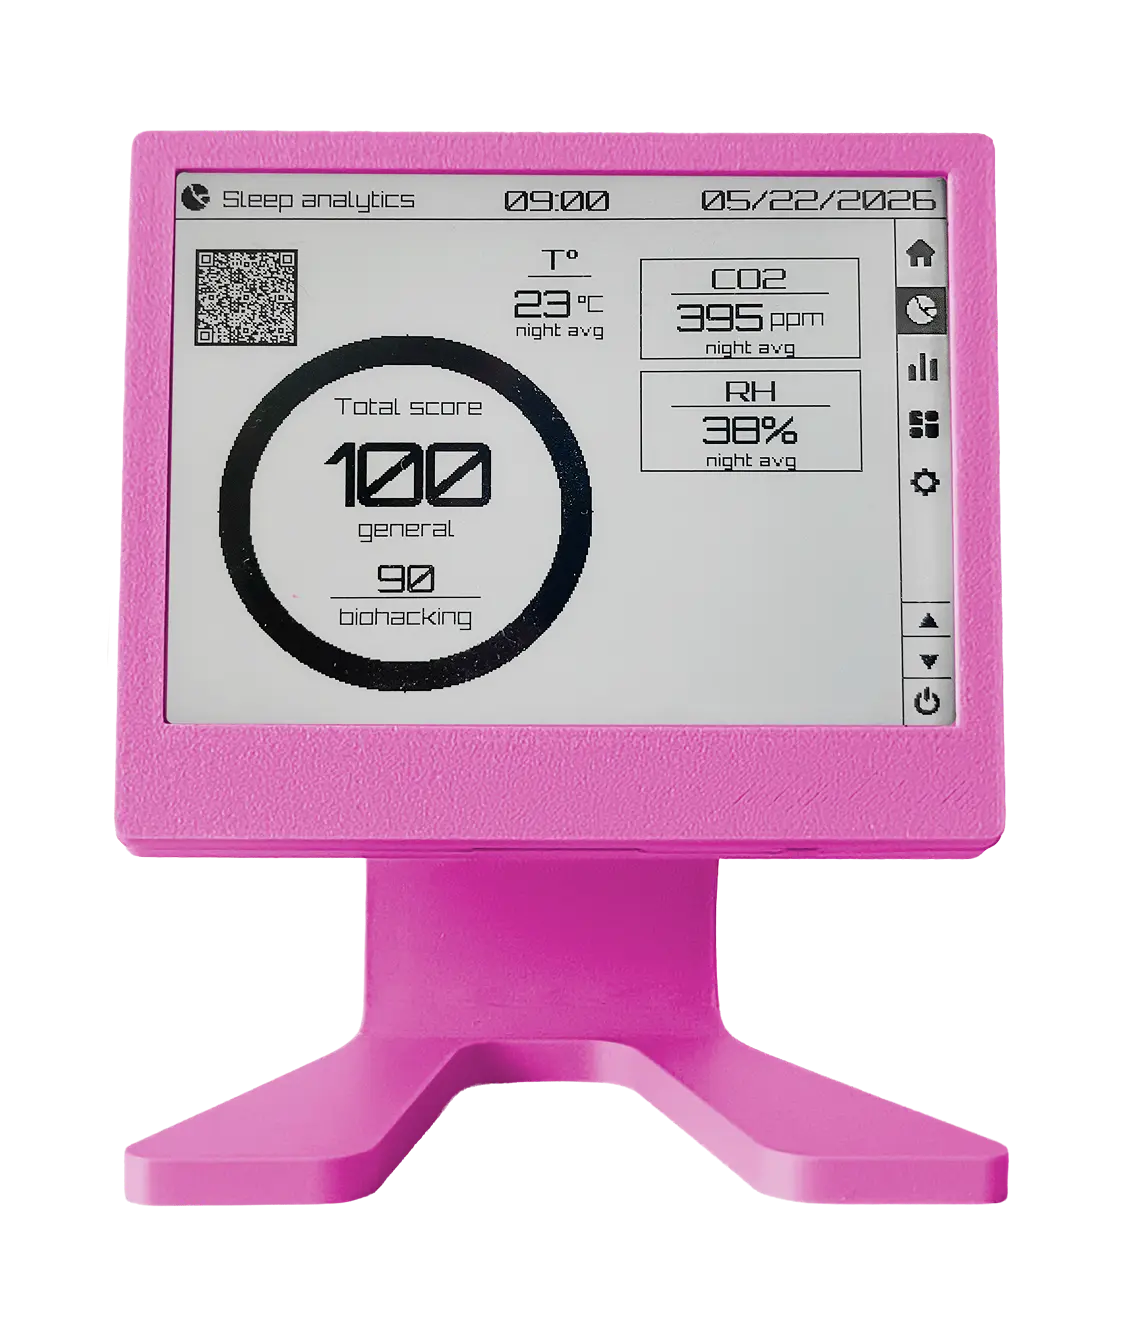
The Sleep Analytics screen includes:
| Element | Meaning |
|---|---|
| Large ring score | Overall comfort score (general model) |
| Biohacking score | Stricter comfort model with tighter thresholds |
| Metric cards | Night summary per sensor (averages; noise = peak hours) |
How Data Is Collected
Insight continuously reads environmental sensors:
- Temperature
- Humidity
- CO₂
If Urban is enabled:
- PM2.5 particles
- Noise (
noiseAvg/noiseMax)
Instead of storing raw high-frequency data, Insight computes hourly averages (and for noise, the hourly maximum of noiseMax), which are stored locally in device memory.
flowchart LR
    Sensors[Sensors] --> Hourly[Hourly averages / max]
    Hourly --> Storage[Local storage (~48h)]
    Storage --> Night[Night window]
    Night --> Score[Comfort Score]
No SD card is required — all required history is stored internally.
Defining the Night Window
The night period is configurable in the web interface:
- Start (default): 22:00
- End (default): 07:00 (exclusive)
This defines a typical sleep window of ~9 hours.
Special cases:
- If start = end → 24/7 mode
- If the night crosses midnight → data is automatically combined across two calendar days
When a Night Report is Generated
A report is only generated when enough data is available:
required_hours = ⌈2/3 × night_length⌉
For a 9-hour night:
- Minimum required data: 6 hours
If insufficient data is available, the system shows:
Night data is collecting
along with the available / expected hours.
How Night Values Are Calculated
For most metrics:
- Sensor data is averaged per hour
- Only hours within the night window are selected
- A simple arithmetic mean is computed per metric
For noise, Insight counts peak hours: an hour is a peak if the maximum noiseMax sample in that hour is > 45 dB. The night card shows the number of such hours (not night-average dB).
The Comfort Score System
Insight converts environmental conditions into a single score from 0 to 100. There are two models:
1. Conservative Model
Designed for general users and broader comfort ranges.
2. Biohacking Model
Uses stricter thresholds for optimization-focused users.
Both models work in a similar way.
Your score starts at 100, which represents ideal sleeping conditions. Each environmental factor (such as CO₂, temperature, humidity, noise, and PM2.5) can slightly reduce this score when it moves away from its comfort range.
All of these small effects are combined into a single total “comfort impact”, which is then applied to the final score.
In simple terms:
Score = 100 − total discomfort (scaled)
score = clamp(100 + 2 × Σ(impact), 0, 100)
How Each Metric Affects the Score
Each environmental factor contributes independently to the final score.
CO₂ (Air Quality)
Elevated CO₂ levels are associated with reduced sleep quality and increased nighttime arousals.
| Model | Threshold | Impact |
|---|---|---|
| Conservative | 750 ppm | −0.52% per +100 ppm |
| Biohacking | 600 ppm | −0.80% per +100 ppm |
Research basis: Controlled indoor studies show reduced deep sleep at elevated CO₂ levels (~2000 ppm conditions).
PM2.5 (Air Particles)
Fine particles are linked to inflammation and reduced sleep efficiency.
| Model | Threshold | Impact |
|---|---|---|
| Conservative | 5 µg/m³ | −0.3% per +10 µg/m³ |
| Biohacking | 3 µg/m³ | −0.5% per +10 µg/m³ |
Research basis: WHO Air Quality Guidelines (2021), respiratory inflammation studies.
Noise (Peak Hours)
Night noise contributes to micro-arousals even when not consciously perceived. Insight scores how many hours had a peak above 45 dB, not the night-average level.
| Model | Allowance (peak hours) | Impact per excess peak |
|---|---|---|
| Conservative | 5 | −2.0% |
| Biohacking | 1 | −3.0% |
excess = max(0, peak_hours − allowance)
impact = −pct_per_peak × excess
Research basis: WHO Environmental Noise Guidelines and sleep arousal literature (peaks matter more than a smoothed average).
Temperature
Thermal conditions strongly influence sleep onset and continuity. Both an upper and a lower bound apply.
| Model | Comfort band | Impact |
|---|---|---|
| Conservative | 19–22°C | −1.5% per °C outside the band |
| Biohacking | 17–20°C | −1.5% per °C outside the band |
Research basis: Sleep thermoregulation studies (Walker, WHOOP datasets, PMC research).
Humidity
Humidity affects airway comfort and perceived air quality.
| Model | Range | Impact |
|---|---|---|
| Conservative | 40–60% | −0.2% per 10% outside range |
| Biohacking | 40–50% | −0.4% per 10% outside range |
Research basis: EPA indoor air quality recommendations and respiratory comfort literature.
Example
If your average CO₂ is 900 ppm:
- Deviation above threshold (conservative): +150 ppm
- Impact ≈ −0.52 × 1.5 = −0.78%
This is then combined with other metrics to form the final score.
A score of 100 means all metrics stayed within ideal comfort ranges (including noise peak allowance).
How Scores Are Interpreted
- 90–100: Excellent environmental conditions
- 70–90: Good, minor deviations
- 50–70: Noticeable environmental stress
- <50: Significant comfort issues
The score is designed as a feedback signal, not a medical metric.
Configuration
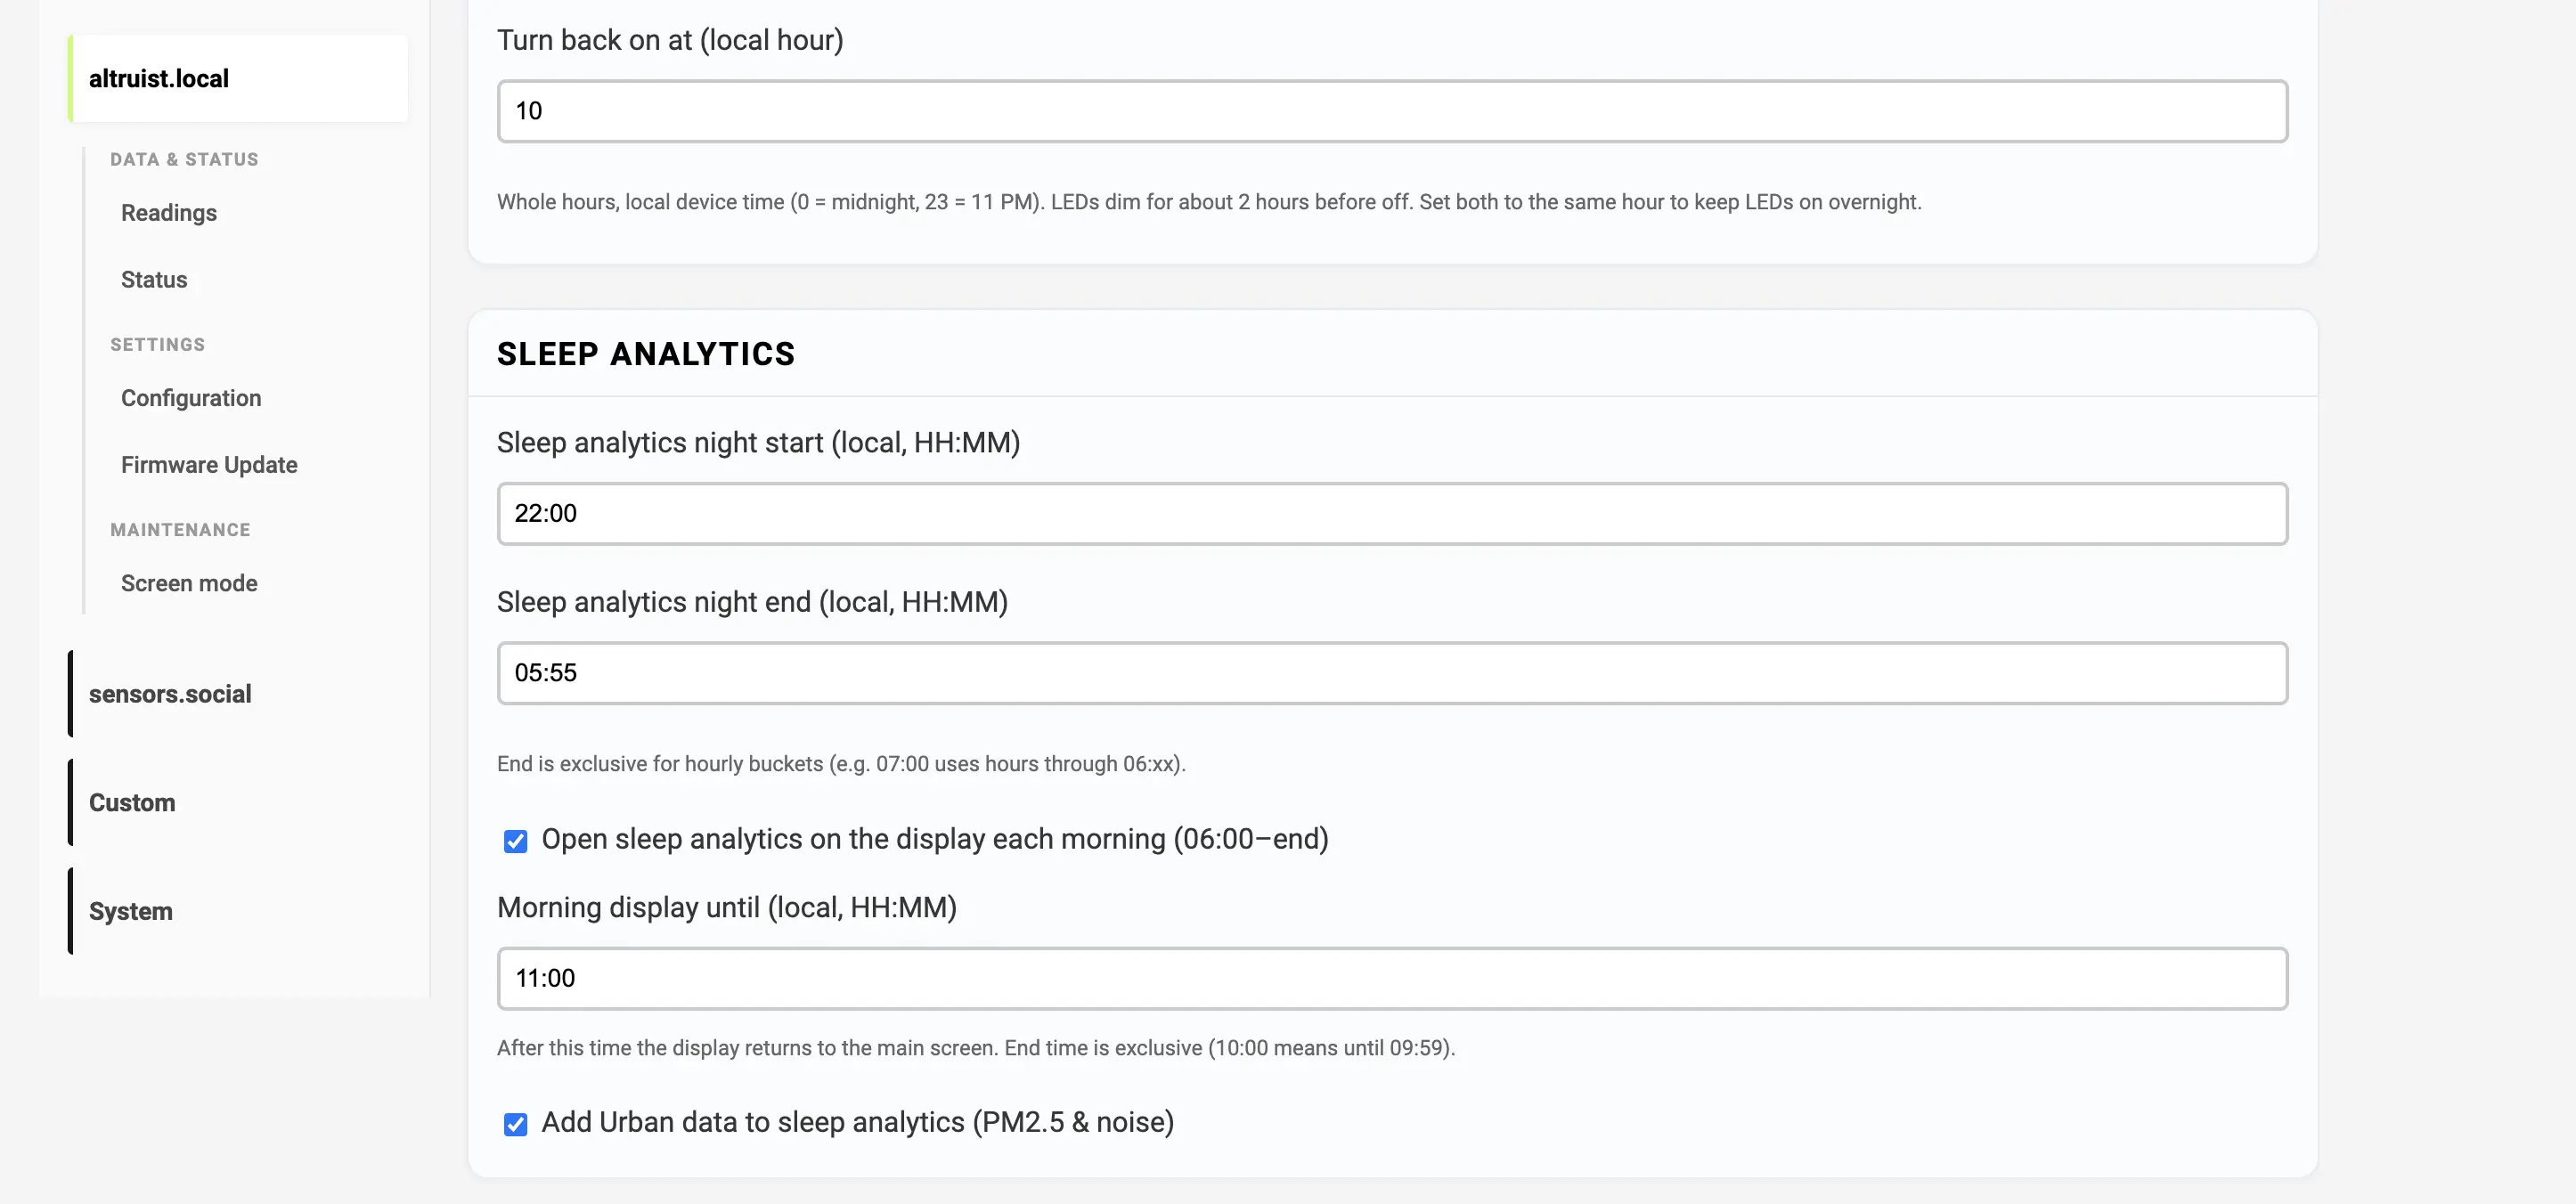
In the web interface you can configure:
- Night start/end times
- Urban sensor integration
- disable opening of sleep analytics screen each morning
Important Limitations
- The device does not measure sleep stages or brain activity
- Short spikes may not significantly affect hourly averages (temperature, humidity, CO₂, PM2.5)
- Noise uses hourly max samples; very brief events can still register as a peak hour if
noiseMaxexceeds 45 dB - First-night data may be incomplete due to buffer initialization
- The score is a sleep environment comfort signal, not a clinical assessment
Summary
Insight Sleep Analytics converts environmental conditions into a unified comfort score using research-informed thresholds and a weighted impact model.
It is still evolving. The model, thresholds, and experience will continue to be refined as we learn from real-world use.
If you’re using Insight, your feedback helps shape what comes next.
Try the device: Insight