
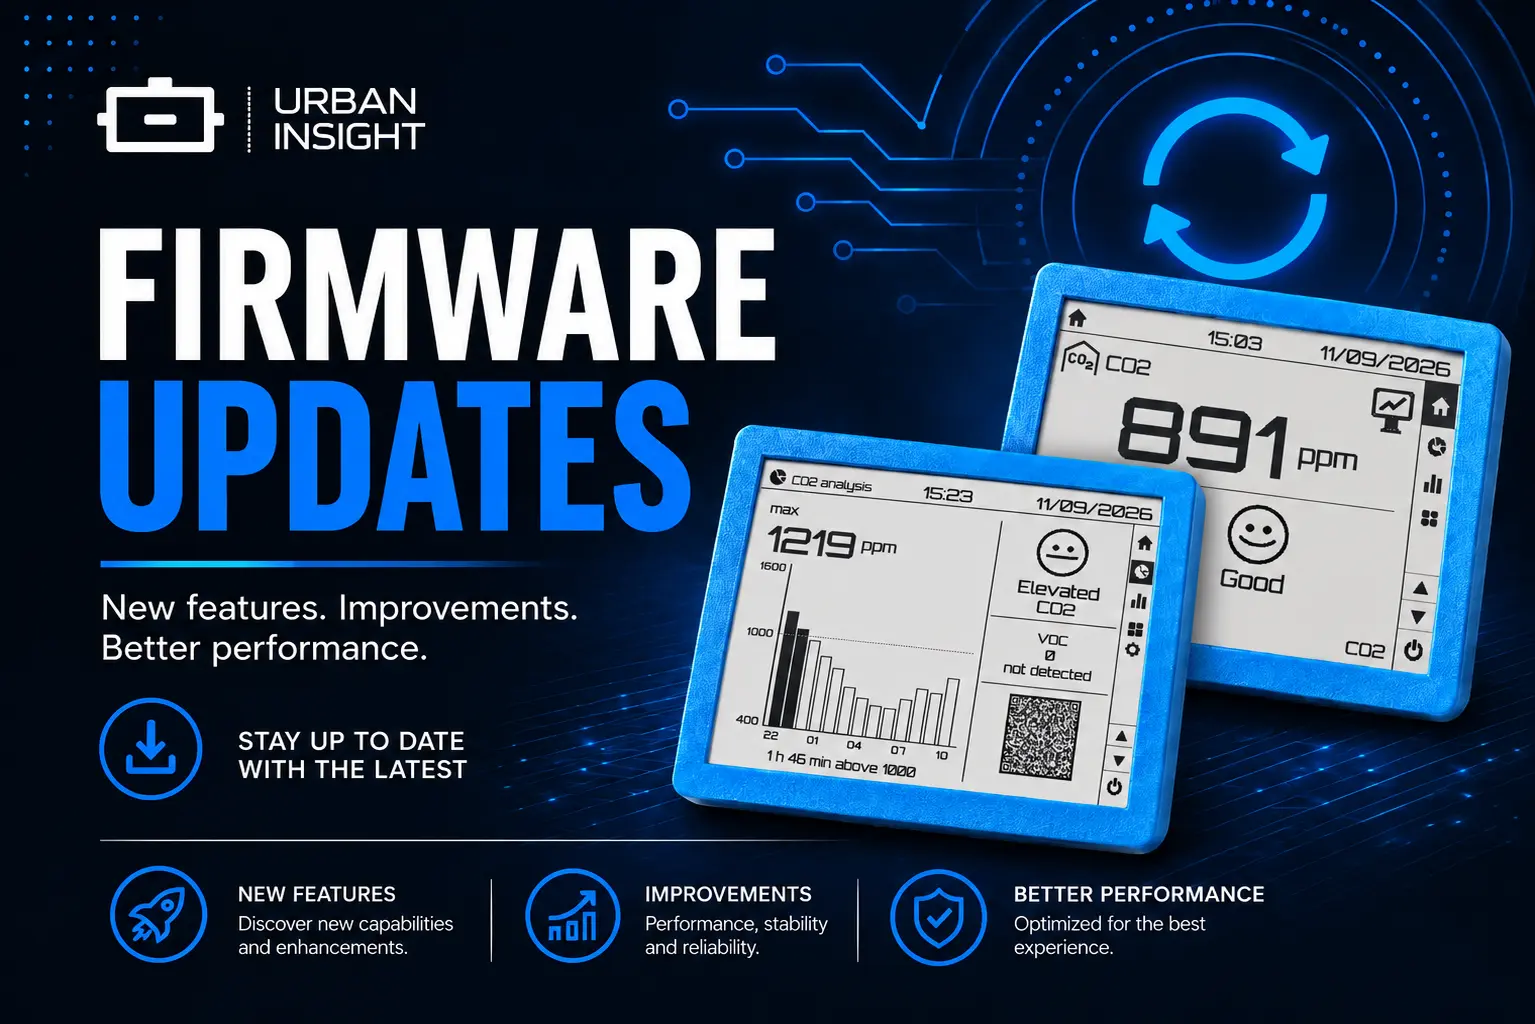
Insight desk mode and night analytics
Desk mode puts one reading on the e-paper at a time, with a 6-hour graph after it. Analytics lets you choose a night comfort score or a CO2-focused night view.
The default Insight main screen still shows everything at once. That is useful at a glance, and hard to read from across the room.
Insight now has Desk — one metric, large, then a graph of the last six hours — and a choice of what the Analytics screen should be: the night comfort score, or a CO2-centered night review.
Desk mode
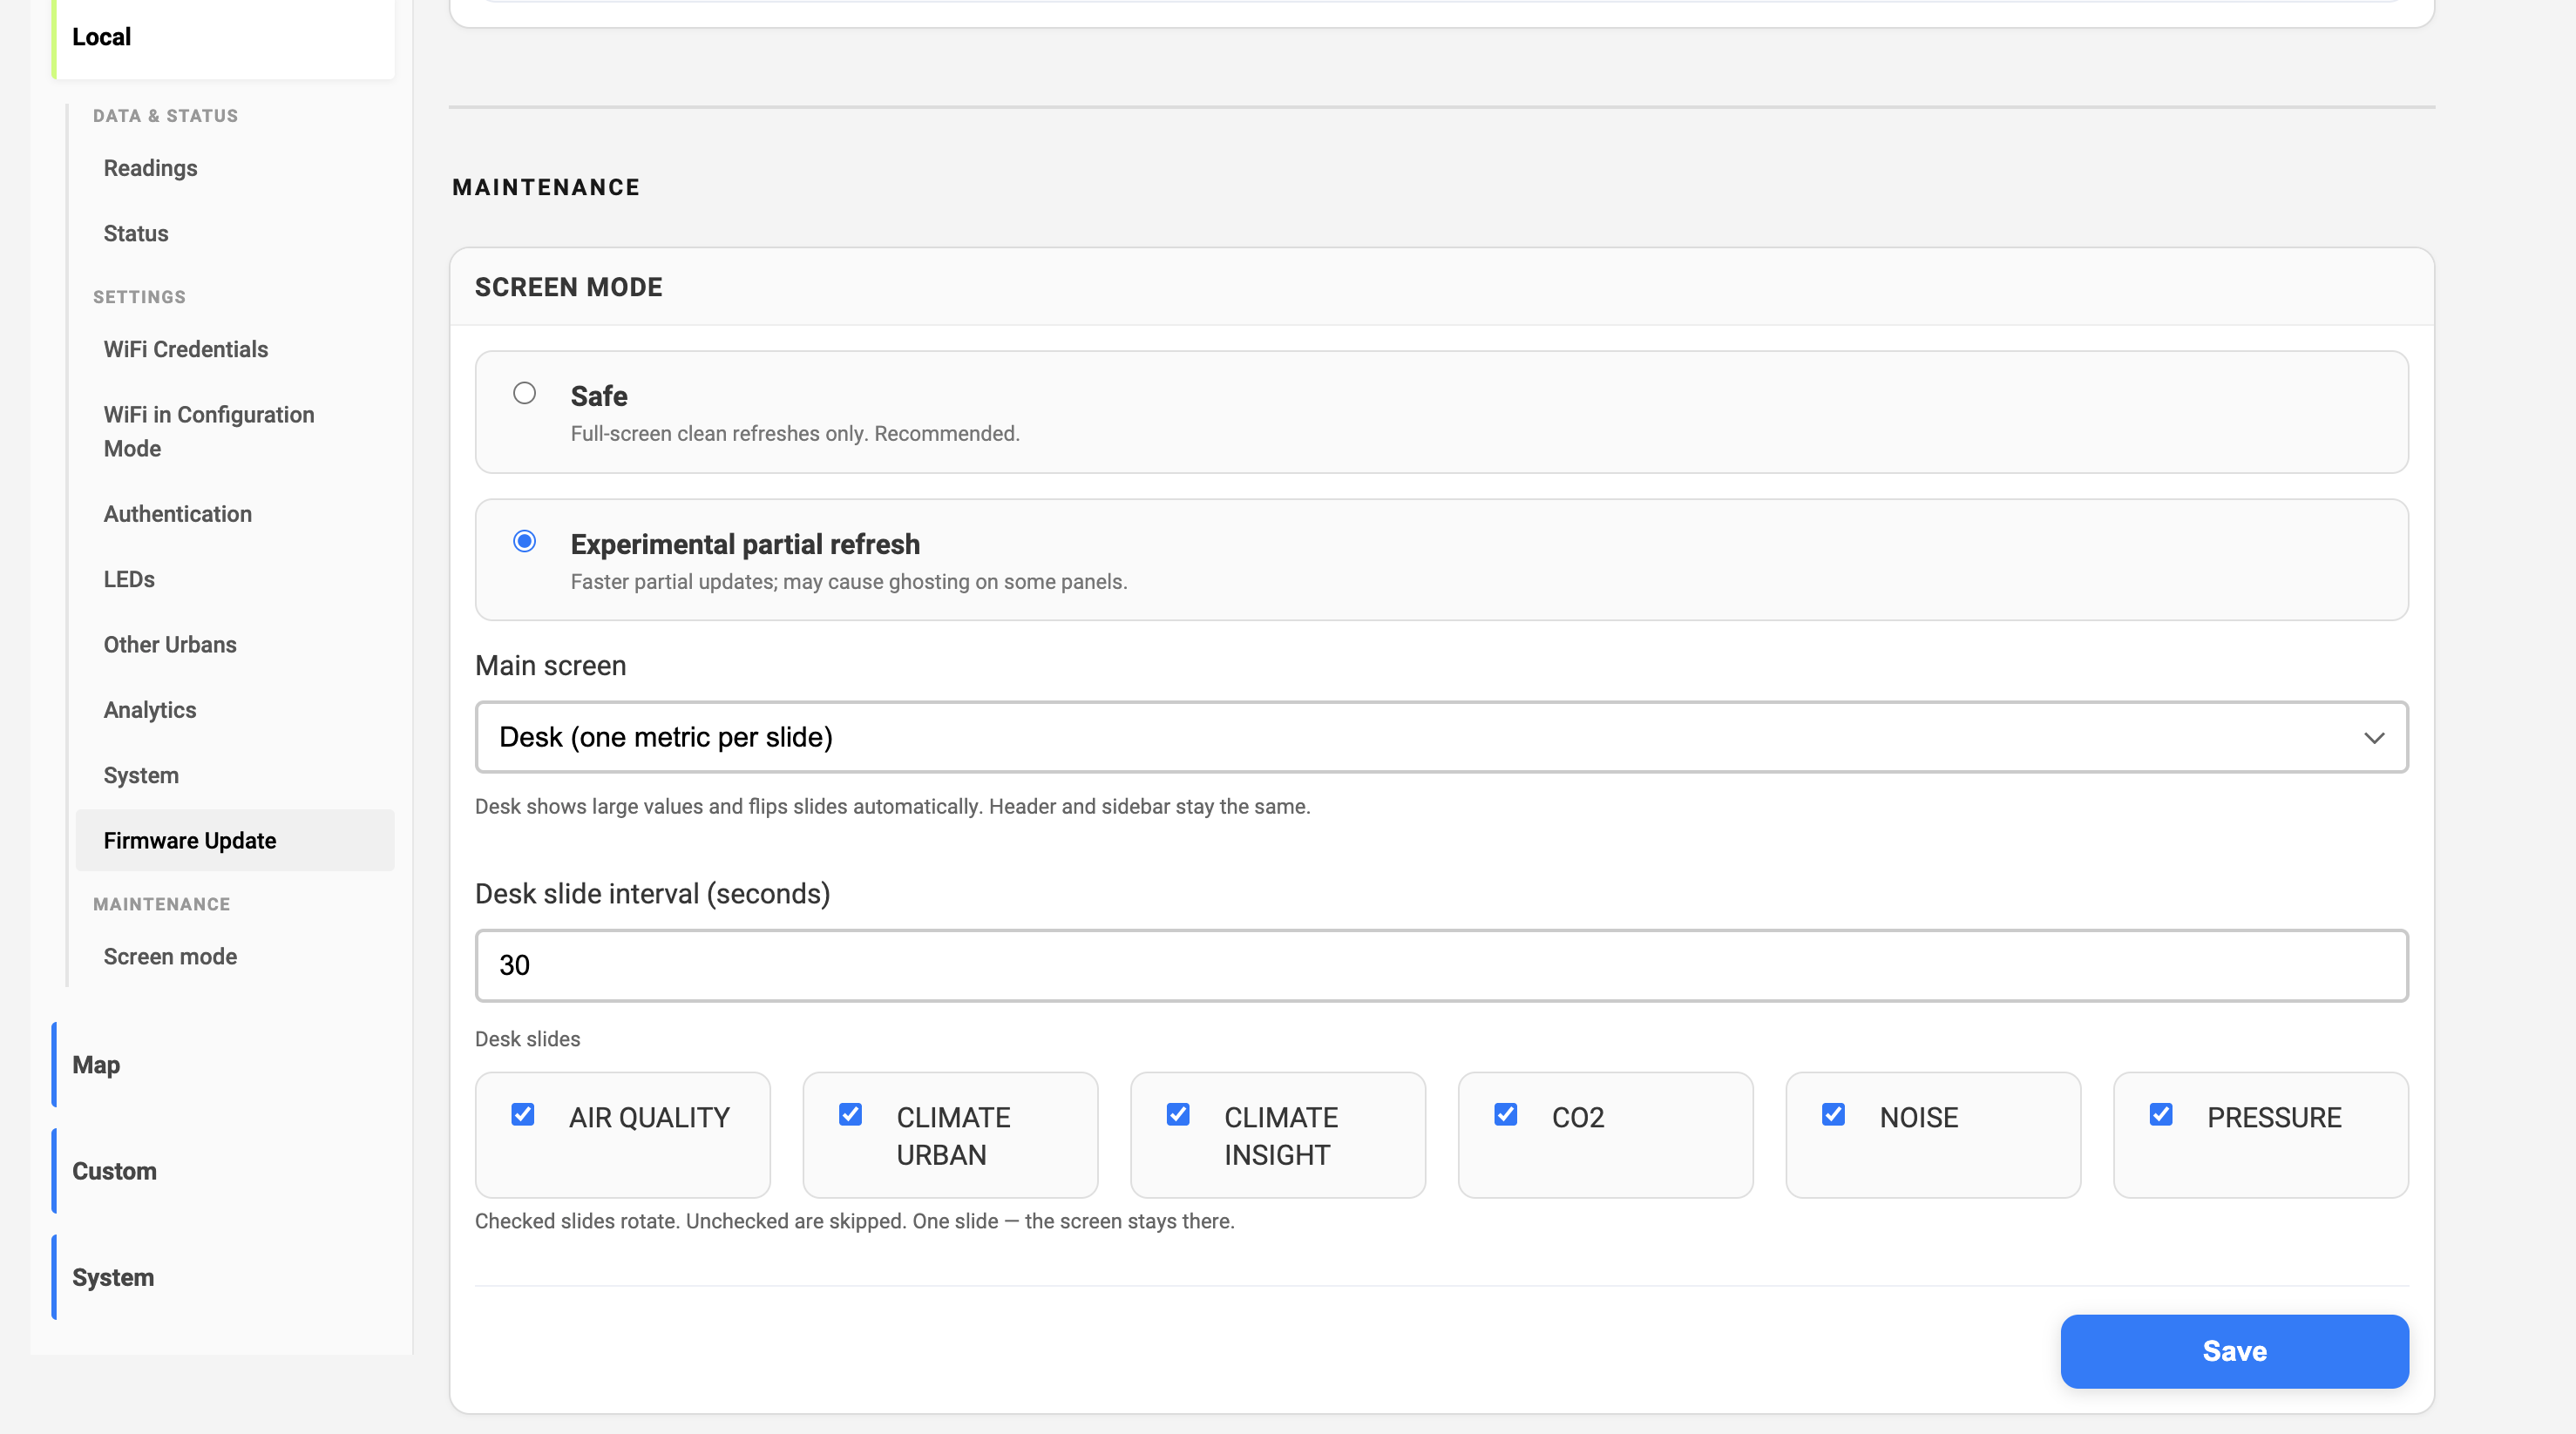
Local → Screen mode, switch Main screen to Desk. Header and sidebar stay the same. The body becomes a carousel.
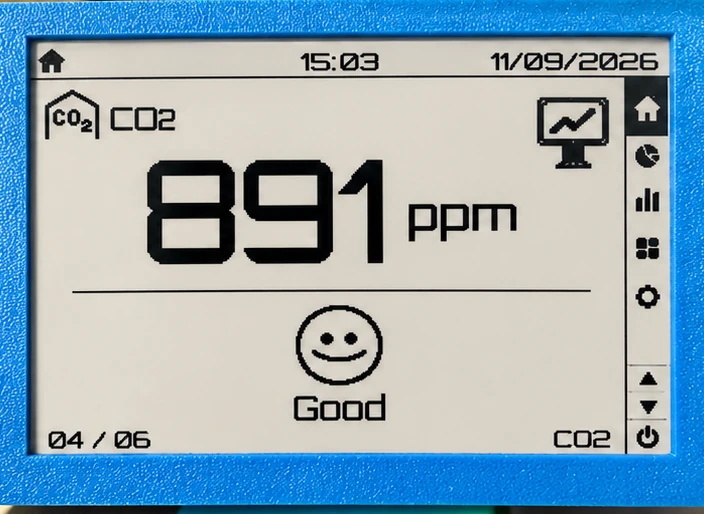
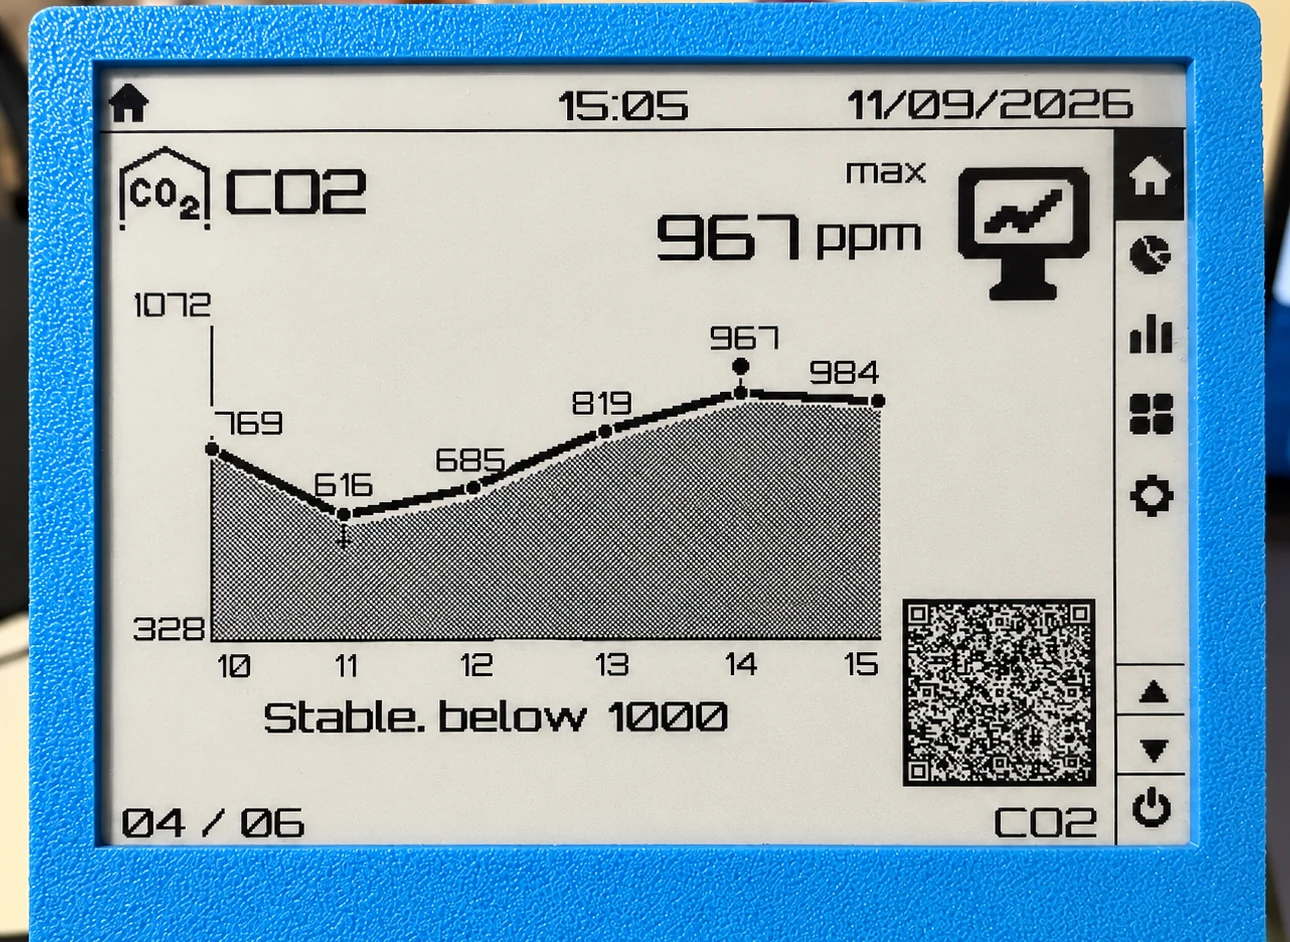
Each metric has two beats:
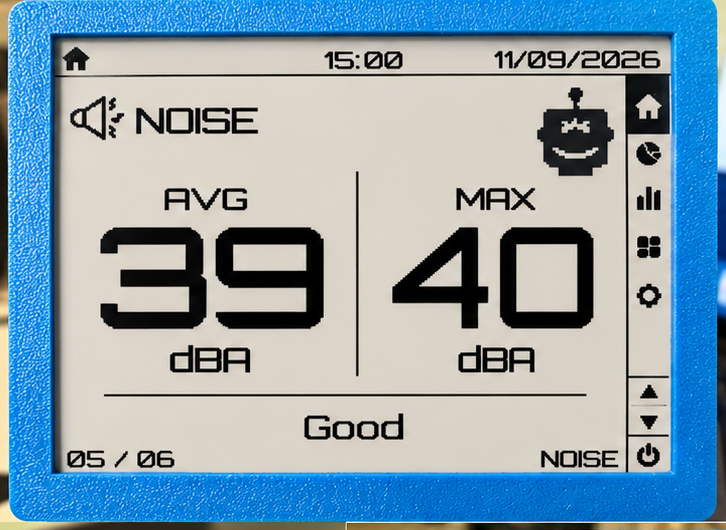
- A large current value (and a short status word: Good / Elevated / High / Low)
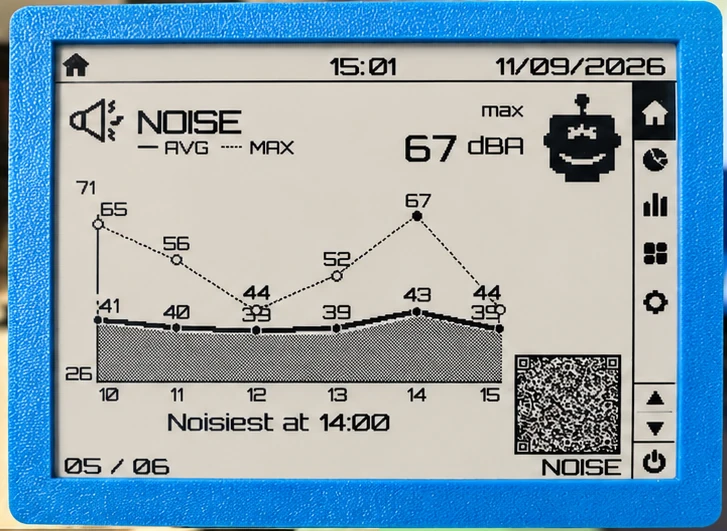
- A full-width graph of the last 6 hours
Then the next metric. Numbers stay for 60 seconds by default; the graph stays 30 seconds. The numbers interval is in the same settings (30–300 s).
Which slides
Checkboxes under Desk slides. Unchecked slides are skipped. One slide — the screen stays there (CO2 only, for example).
| Slide | What you see |
|---|---|
| Air | PM2.5 and PM10, then a graph for each |
| Climate Urban | Outdoor temperature and humidity |
| Climate Insight | Indoor temperature and humidity |
| CO2 | Indoor CO2 |
| Noise | Average and max, then one graph with both |
| Pressure | Urban and Insight, if both are there |
Standalone Insight hides the Urban-only slides (air, noise, outdoor climate).
The graph is an hourly line, not a wait-for-six-hours screen: empty hours stay on the axis, the line connects across gaps. A peak mark sits on the true high. After a reboot the current hour can look empty until the sensor publishes again — older hours stay.
A QR on the graph opens that metric on sensors.social.
Analytics: night score or CO2
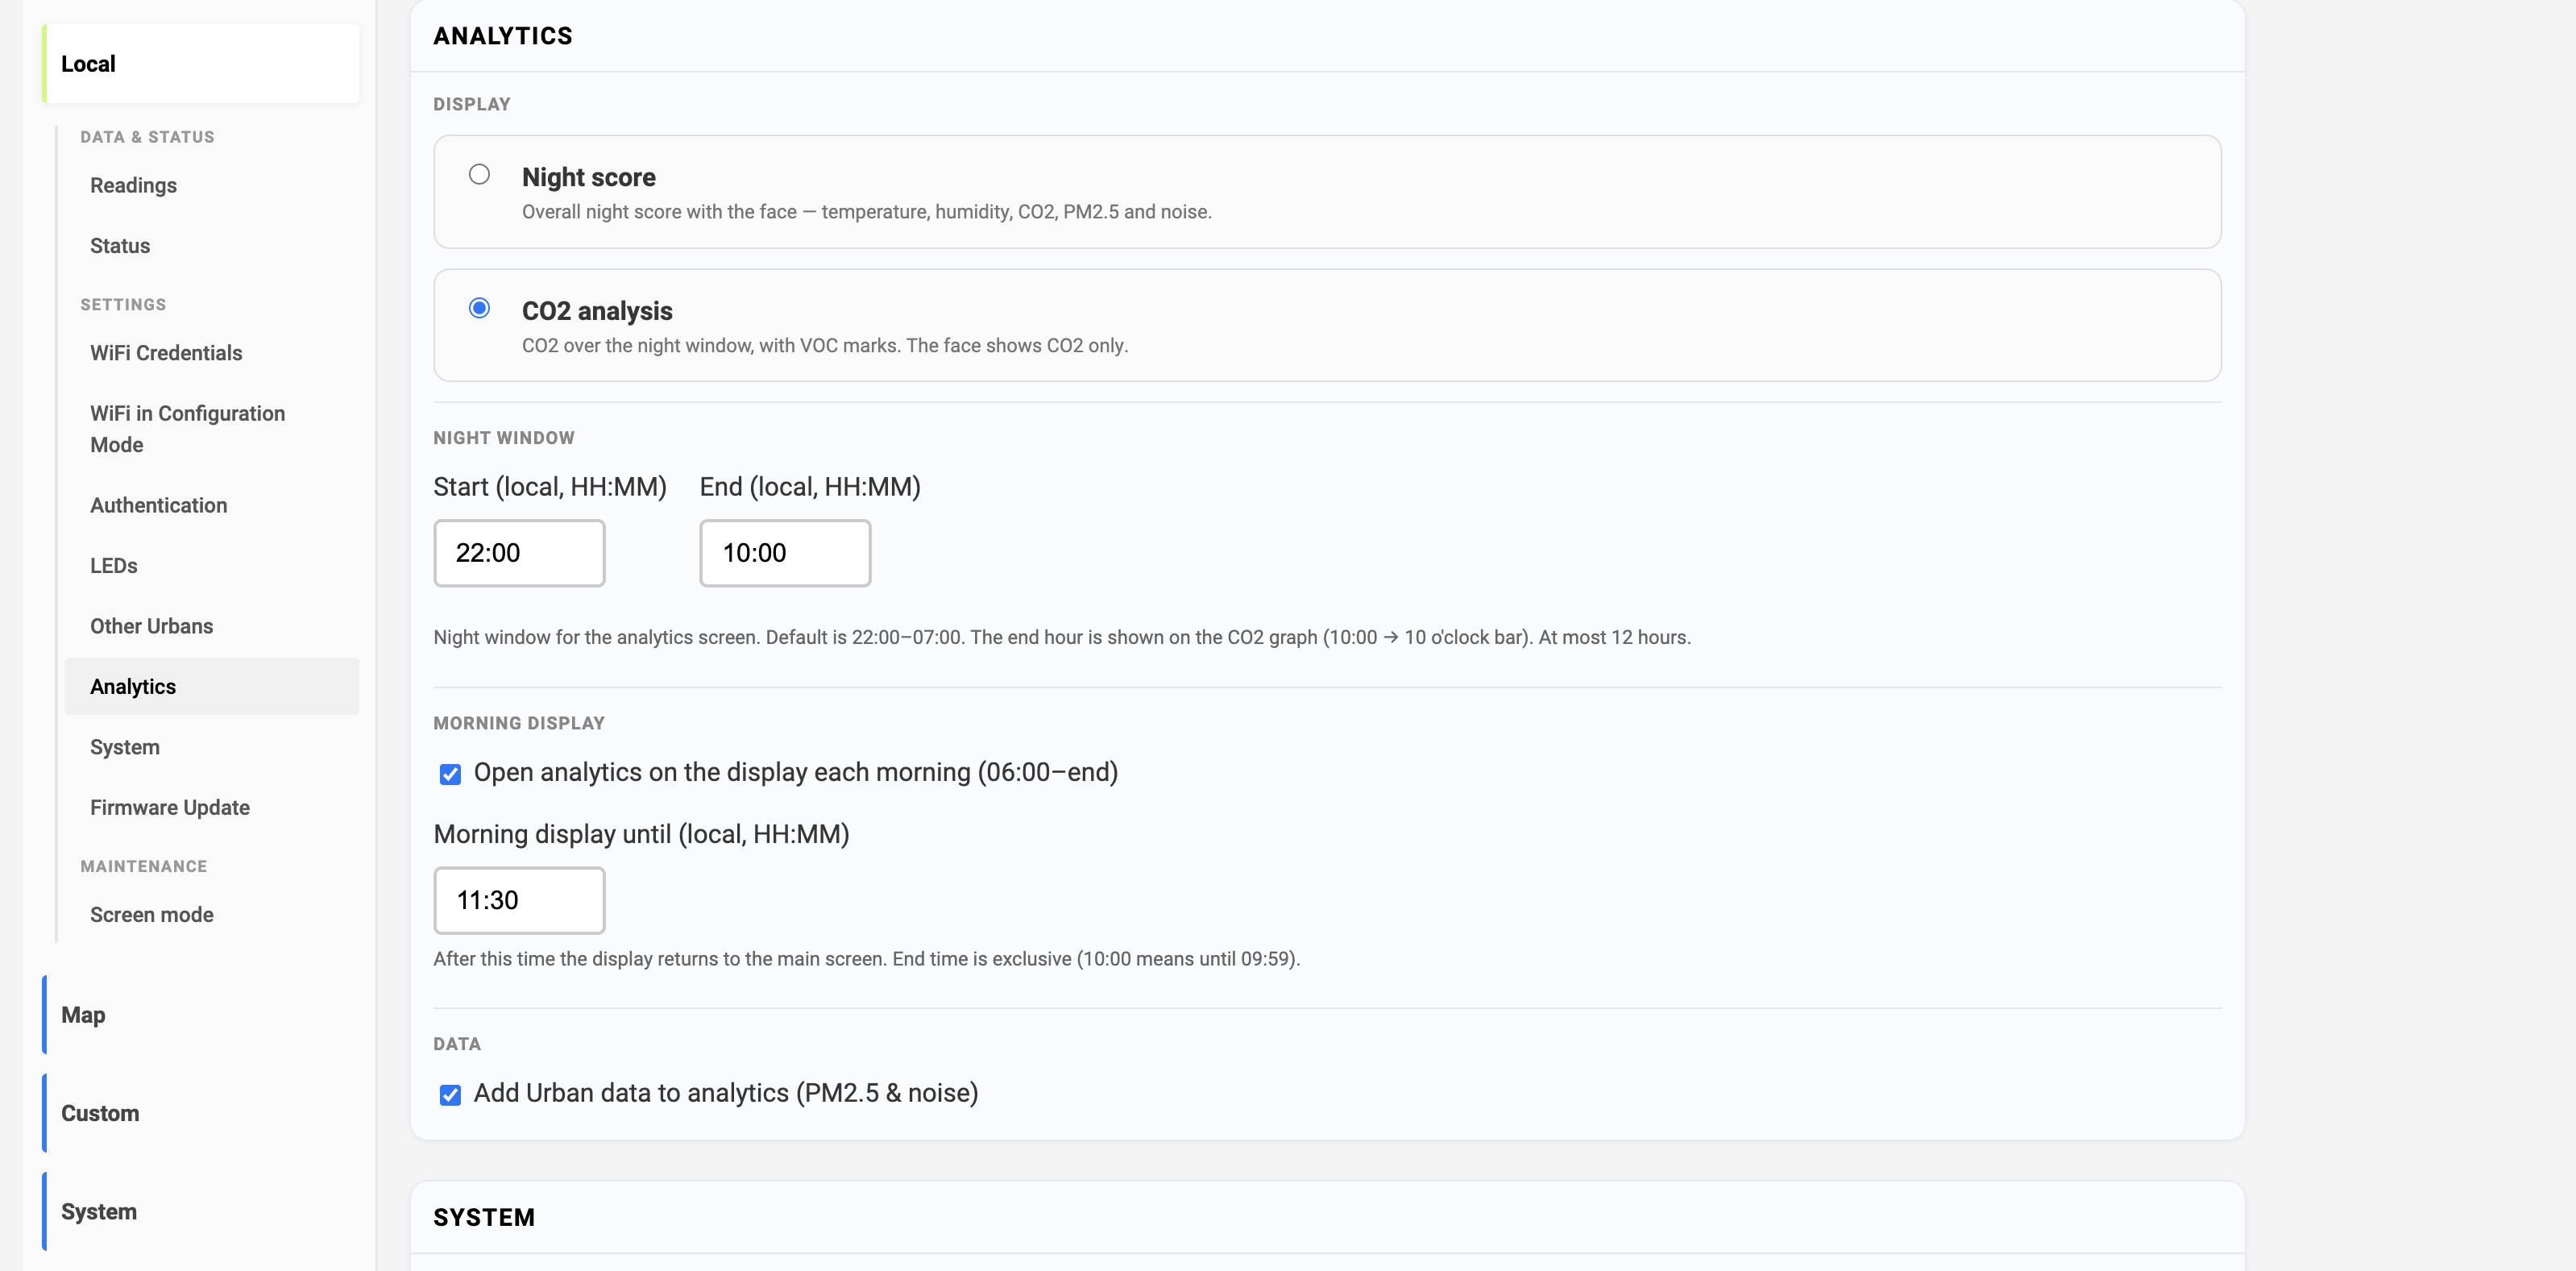
The settings block is now Analytics (it used to be Sleep analytics). Two screens, same night window:
| Option | What the e-paper shows |
|---|---|
| Night score | A circle score — temperature, humidity, CO2, PM2.5 and noise |
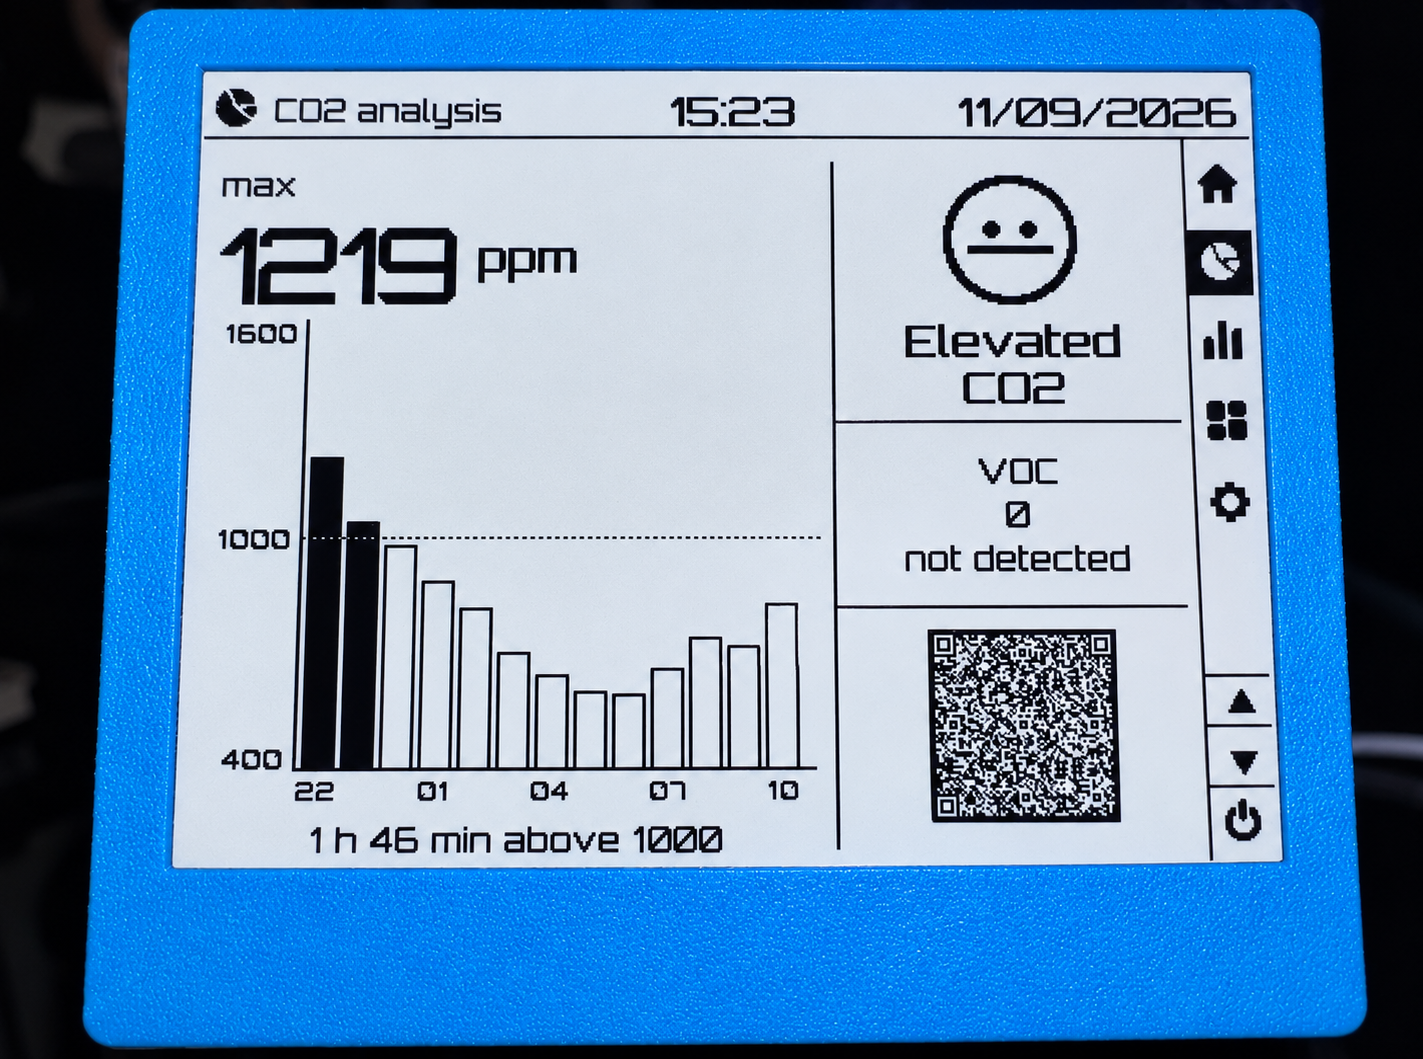
| CO2 analysis | Night CO2 as hourly bars, VOC spikes, a CO2-only face, then a QR |
CO2 analysis is the default, so a device you already use does not jump to a different analytics layout after the update. Switch to Night score if you want the circle score.
How the CO2 screen reads:
- Each bar is that hour’s max CO2
- The bar fills when the peak is ≥ 1000 ppm
- Minutes above 1000 come from how much of the hour was over that line (≥ 90% of the samples counts as the whole hour)
- Face: Good / Elevated / High for CO2 only (High if max ≥ 2000 ppm, Elevated if at least 30 minutes over 1000)
- VOC is a spike count for this night window
The older Night score model is unchanged in spirit; the full write-up is Insight Sleep Analytics. One update: a noise peak hour is now > 40 dBA (it was 45).
Night window
Default is 22:00–07:00 local. Set any start and end in Analytics settings. The window is at most 12 hours — a longer range is clipped from the start so the bars still fit. The end hour is drawn (22:00–10:00 shows a 10 o’clock bar).
If something looks off
If a slide is blank, a graph caption looks wrong, or the night window does not match what you set, open an issue at github.com/airalab/altruist-firmware and include the version from Status → Technical details.